Monthly report from Markdown to PDF
This is the shape of a report an organization issues every month: contents, metrics, a diagram, a chart, a formula and a sign-off.
Front matter, a table of contents, a definition list, metrics tables, a flowchart, a chart, a formula, footnotes and a sign-off block: the shape of a report an organization issues every month.
Markdown source
Markdown · 121 lines---
title: Monthly operations report, March 2026
author: Operations office
language: en-US
---
# Monthly operations report, March 2026
Report period
: 1 March to 31 March 2026
Prepared for
: The board of the metro and tram network, and the quarterly return to the regulator
Data taken on
: 13 April 2026, from the operations control system and the ticketing platform
Status
: Final. This report is produced from the same data each month and sealed before filing.
[TOC]
## 1. Executive summary
March was a better month than February on every measure except step-free access, where the two lifts at the central interchange were out of service until 19 March.
The network ran 140,200 of 141,100 scheduled journeys, which is 99.4 per cent and above the 98.5 per cent the regulator requires. Of those, 94.6 per cent arrived within three minutes of the timetable, up from 93.9 per cent. Boardings reached 13.1 million, 4.2 per cent more than in March 2025, with the new tram extension carrying 410,000 of them.
We opened 2,980 complaints and closed 3,040, so the open stock fell by 60 cases. The share answered within ten working days was 97.4 per cent.
## 2. Metrics
| Measure | February | March | Change | Target |
|---------|---------:|------:|-------:|-------:|
| Scheduled journeys run | 99.0 % | 99.4 % | +0.4 pt | 98.5 % or more |
| Journeys within 3 minutes | 93.9 % | 94.6 % | +0.7 pt | 93.0 % or more |
| Boardings (million) | 12.4 | 13.1 | +5.6 % | |
| Complaints opened | 3,210 | 2,980 | -7.2 % | 3,200 or fewer |
| Complaints answered in 10 working days | 96.8 % | 97.4 % | +0.6 pt | 95.0 % or more |
| Lift hours in service | 96.1 % | 97.8 % | +1.7 pt | 98.0 % or more |
| Energy per vehicle-kilometer (kWh) | 2.84 | 2.71 | -4.6 % | 2.80 or less |
| Safety incidents | 71 | 68 | -4.2 % | |
Each measure is defined at the end of this report[^defs]. Percentage point changes are written as *pt*; the other changes are the change against February as a share of the February figure.
## 3. Punctuality
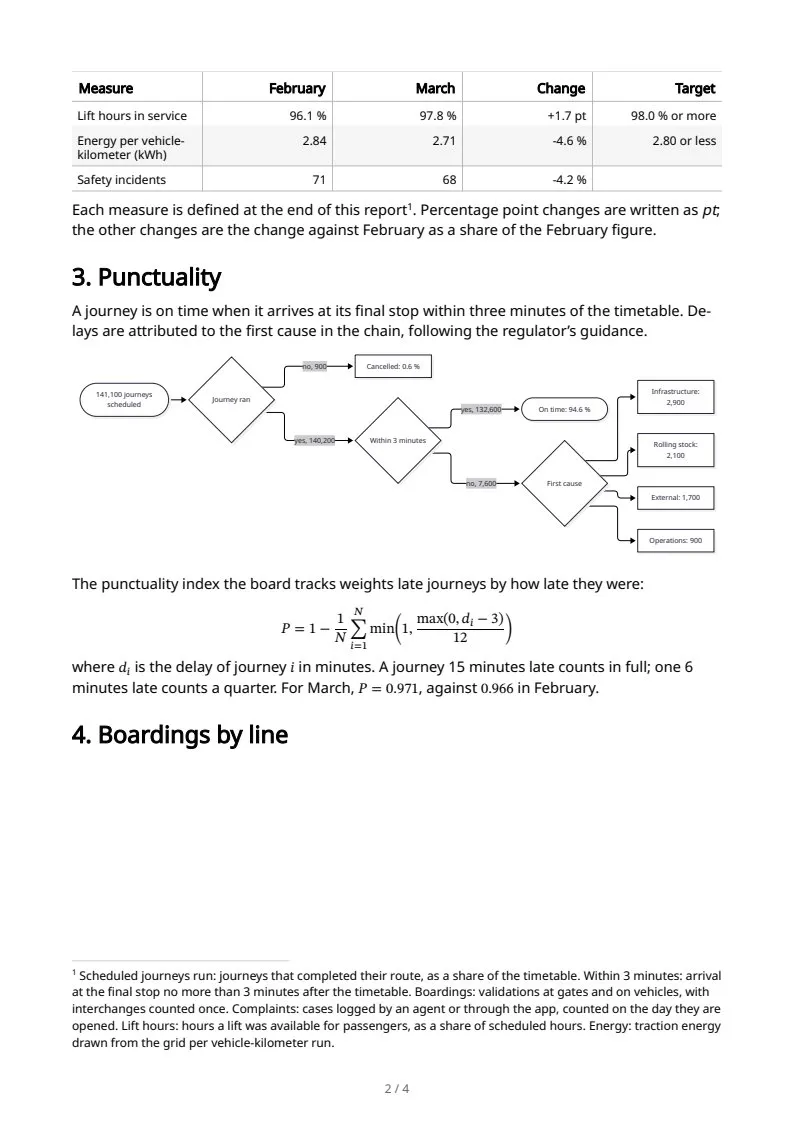
A journey is on time when it arrives at its final stop within three minutes of the timetable. Delays are attributed to the first cause in the chain, following the regulator's guidance.
```mermaid
flowchart LR
run([141,100 journeys scheduled]) --> ran{Journey ran}
ran -->|no, 900| cancel[Cancelled: 0.6 %]
ran -->|yes, 140,200| time{Within 3 minutes}
time -->|yes, 132,600| ontime([On time: 94.6 %])
time -->|no, 7,600| cause{First cause}
cause --> infra[Infrastructure: 2,900]
cause --> fleet[Rolling stock: 2,100]
cause --> ext[External: 1,700]
cause --> ops[Operations: 900]
```
The punctuality index the board tracks weights late journeys by how late they were:
$ P = 1 - \frac{1}{N} \sum_{i=1}^{N} \min\!\left( 1, \frac{\max(0, d_i - 3)}{12} \right) $
where $d_i$ is the delay of journey $i$ in minutes. A journey 15 minutes late counts in full; one 6 minutes late counts a quarter. For March, $P = 0.971$, against $0.966$ in February.
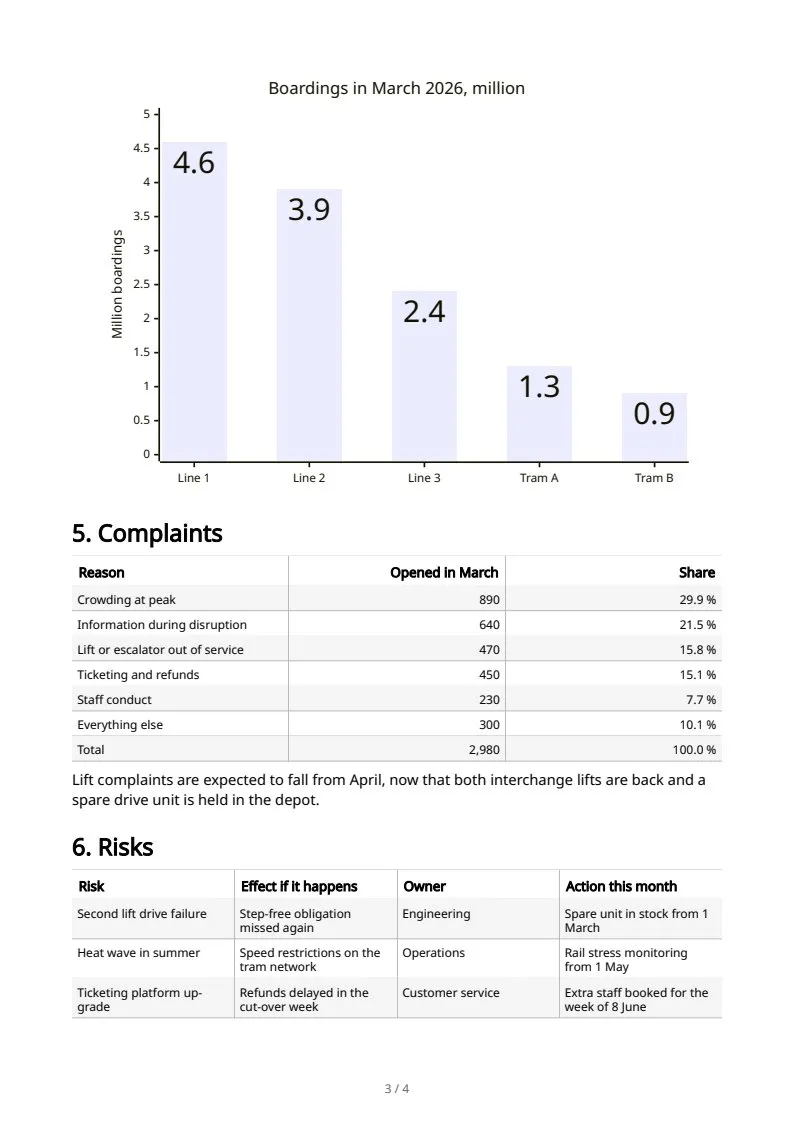
## 4. Boardings by line
```mermaid
---
config:
xyChart:
showDataLabel: true
---
xychart
title "Boardings in March 2026, million"
x-axis ["Line 1", "Line 2", "Line 3", "Tram A", "Tram B"]
y-axis "Million boardings" 0 --> 5
bar [4.6, 3.9, 2.4, 1.3, 0.9]
```
## 5. Complaints
| Reason | Opened in March | Share |
|--------|----------------:|------:|
| Crowding at peak | 890 | 29.9 % |
| Information during disruption | 640 | 21.5 % |
| Lift or escalator out of service | 470 | 15.8 % |
| Ticketing and refunds | 450 | 15.1 % |
| Staff conduct | 230 | 7.7 % |
| Everything else | 300 | 10.1 % |
| Total | 2,980 | 100.0 % |
Lift complaints are expected to fall from April, now that both interchange lifts are back and a spare drive unit is held in the depot.
## 6. Risks
| Risk | Effect if it happens | Owner | Action this month |
|------|----------------------|-------|-------------------|
| Second lift drive failure | Step-free obligation missed again | Engineering | Spare unit in stock from 1 March |
| Heat wave in summer | Speed restrictions on the tram network | Operations | Rail stress monitoring from 1 May |
| Ticketing platform upgrade | Refunds delayed in the cut-over week | Customer service | Extra staff booked for the week of 8 June |
## 7. Method and definitions
Figures are taken on the seventh working day after month end, so late corrections to the last two days of the month are included. The punctuality figure moves by about a tenth of a point over the following 30 days as disputed attributions are settled, and this report is not restated when they do.
## 8. Sign-off
| Role | Date |
|------|------|
| Regulatory reporting manager, prepared | 13 April 2026 |
| Head of operations control, checked | 14 April 2026 |
| Head of customer service, checked | 14 April 2026 |
| Director of operations, approved | 15 April 2026 |
[^defs]: Scheduled journeys run: journeys that completed their route, as a share of the timetable. Within 3 minutes: arrival at the final stop no more than 3 minutes after the timetable. Boardings: validations at gates and on vehicles, with interchanges counted once. Complaints: cases logged by an agent or through the app, counted on the day they are opened. Lift hours: hours a lift was available for passengers, as a share of scheduled hours. Energy: traction energy drawn from the grid per vehicle-kilometer run.
*All organizations in the sample documents are invented. Names and figures are illustrative.*
Rendered pages
PDF · 4 pages · 36 KB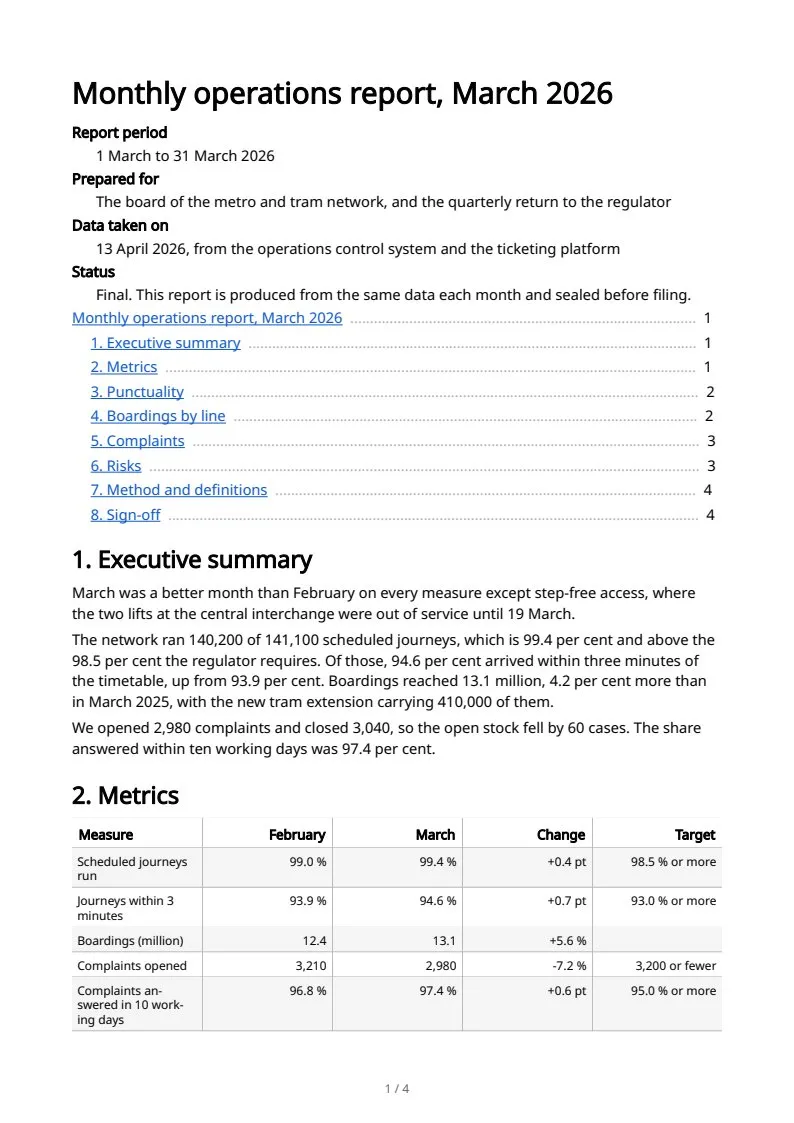
The sample documents describe invented organizations in several countries. All names and figures are illustrative.
Whole documents from Markdown to PDF: every sampleIn the Markdown reference