Mermaid bar and line chart in Markdown to PDF
Bars and lines share the axes, with data labels and your own colors.
An xychart with bars and lines on one axis, named categories, data labels and a custom palette, for a city's climate and a shop's sales.
Markdown source
Markdown · 44 lines# Bar and line charts
Average monthly temperature as a line over rainfall as bars, for a coastal city:
```mermaid
xychart
title "Climate normals, 1991 to 2020"
x-axis [Jan, Feb, Mar, Apr, May, Jun, Jul, Aug, Sep, Oct, Nov, Dec]
y-axis "Rainfall (mm) and temperature (°C × 5)" 0 --> 160
bar [112, 88, 74, 62, 48, 21, 6, 9, 38, 95, 128, 134]
line [48, 52, 64, 76, 94, 112, 124, 126, 110, 88, 66, 52]
```
Categories can be words, and data labels can be switched on:
```mermaid
---
config:
xyChart:
showDataLabel: true
---
xychart
title "Cups sold per day, by drink"
x-axis [Espresso, Latte, "Flat white", "Cold brew", Matcha, Tea]
y-axis "Cups" 0 --> 140
bar [96, 128, 84, 61, 44, 37]
```
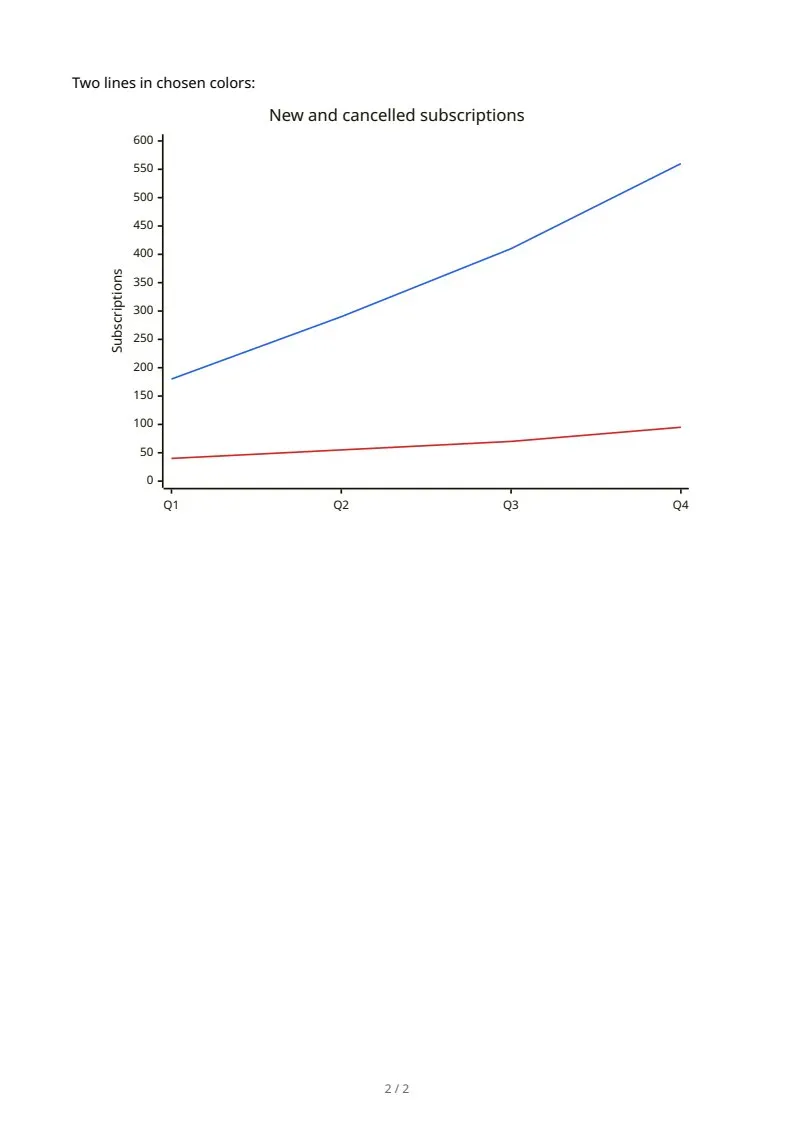
Two lines in chosen colors:
```mermaid
---
config:
themeVariables:
xyChart:
plotColorPalette: '#2563eb, #dc2626'
---
xychart
title "New and cancelled subscriptions"
x-axis [Q1, Q2, Q3, Q4]
y-axis "Subscriptions" 0 --> 600
line [180, 290, 410, 560]
line [40, 55, 70, 95]
```
Rendered pages
PDF · 2 pages · 11 KB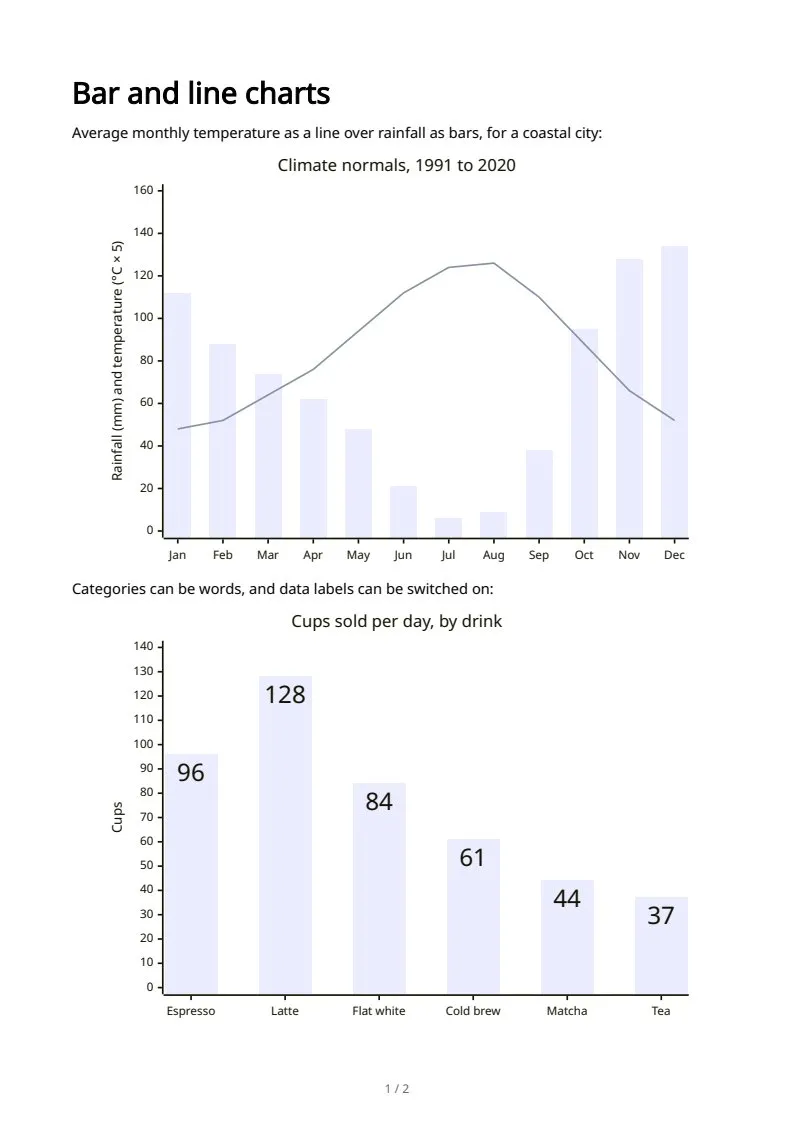
The sample documents describe invented organizations in several countries. All names and figures are illustrative.
Mermaid charts in Markdown to PDF: every sampleIn the Markdown reference