Mermaid charts in Markdown to PDF
Each chart is written as a few lines of text and drawn as vector graphics. The numbers stay in the Markdown, so the chart changes when the data does.
Pie, bar and line, quadrant, radar, Sankey and treemap charts written as text, drawn as vector graphics (toggle: mermaid).
Pie charts
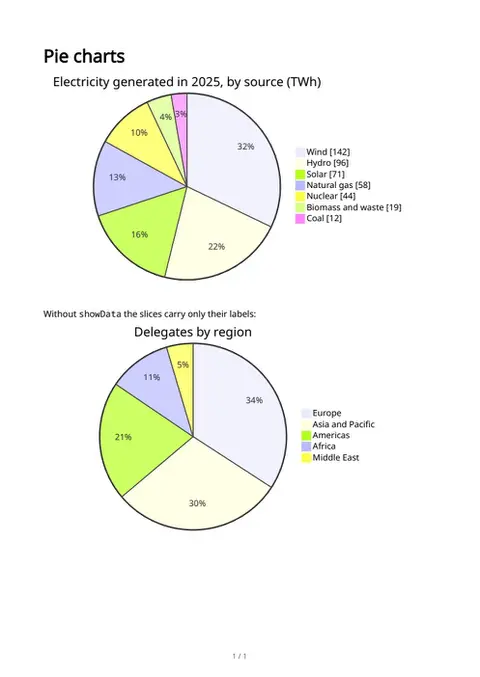
Shares as a pie, with or without the values printed on the slices, for the electricity mix of a region.
Bar and line charts
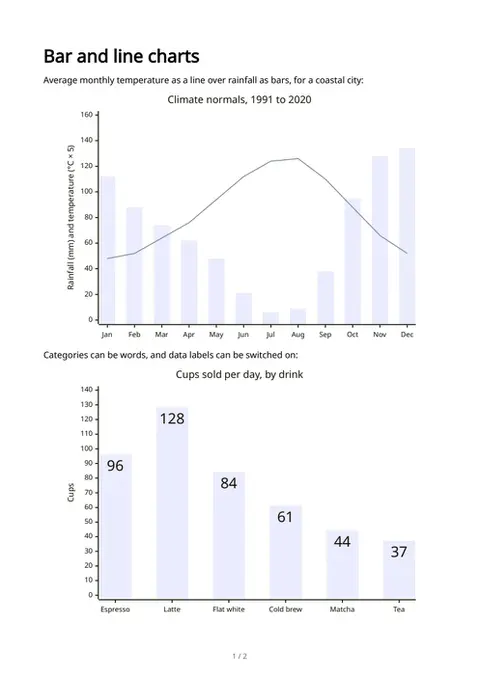
An xychart with bars and lines on one axis, named categories, data labels and a custom palette, for a city's climate and a shop's sales.
Quadrant charts
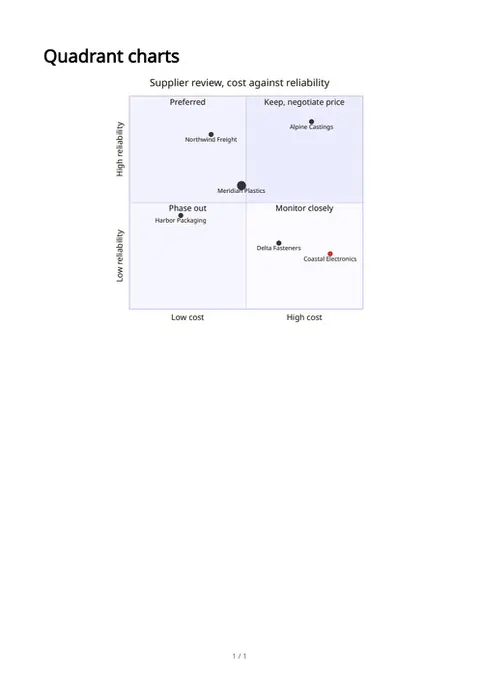
Points on two axes with a label in each quadrant, point sizes and a class with its own color, for a supplier review.
Radar charts
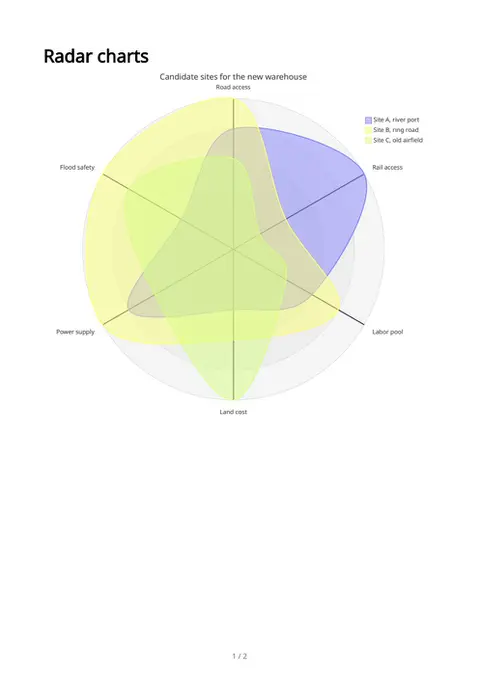
Several curves over named axes, with a circular or polygon grid and fixed minimum and maximum, comparing three candidate sites for a warehouse.
Sankey diagrams
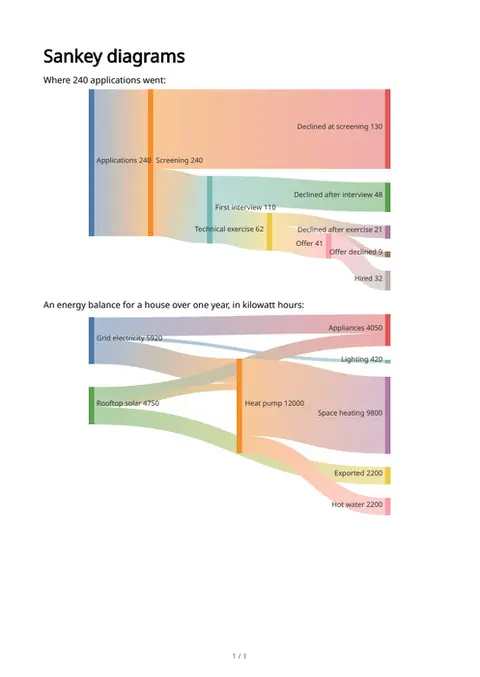
Flows as proportional bands from source to target, written as comma-separated rows, for a hiring funnel and a household energy balance.
Treemaps
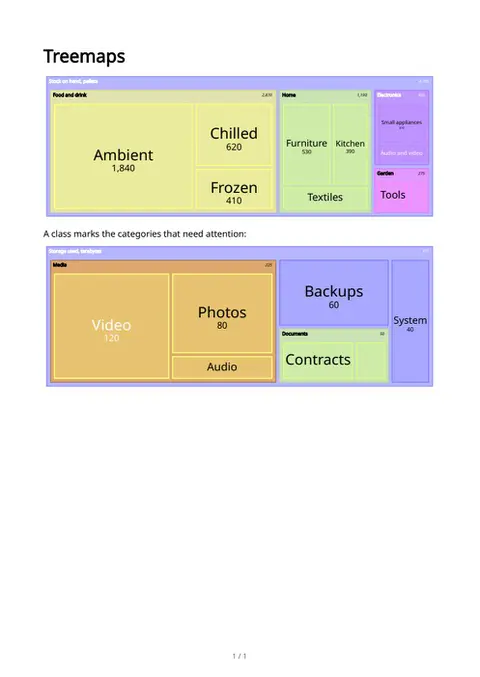
Nested rectangles sized by value, with a value format and a styled class, for the stock of a warehouse by category.
The sample documents describe invented organizations in several countries. All names and figures are illustrative.