Mermaid radar chart in Markdown to PDF
Several options are compared over named axes, on a circular or polygon grid with a fixed scale.
Several curves over named axes, with a circular or polygon grid and fixed minimum and maximum, comparing three candidate sites for a warehouse.
Markdown source
Markdown · 31 lines# Radar charts
```mermaid
---
title: "Candidate sites for the new warehouse"
---
radar
axis road["Road access"], rail["Rail access"], labor["Labor pool"]
axis cost["Land cost"], grid["Power supply"], flood["Flood safety"]
curve a["Site A, river port"]{4, 5, 3, 2, 4, 2}
curve b["Site B, ring road"]{5, 2, 4, 3, 5, 5}
curve c["Site C, old airfield"]{3, 1, 2, 5, 3, 4}
max 5
min 0
```
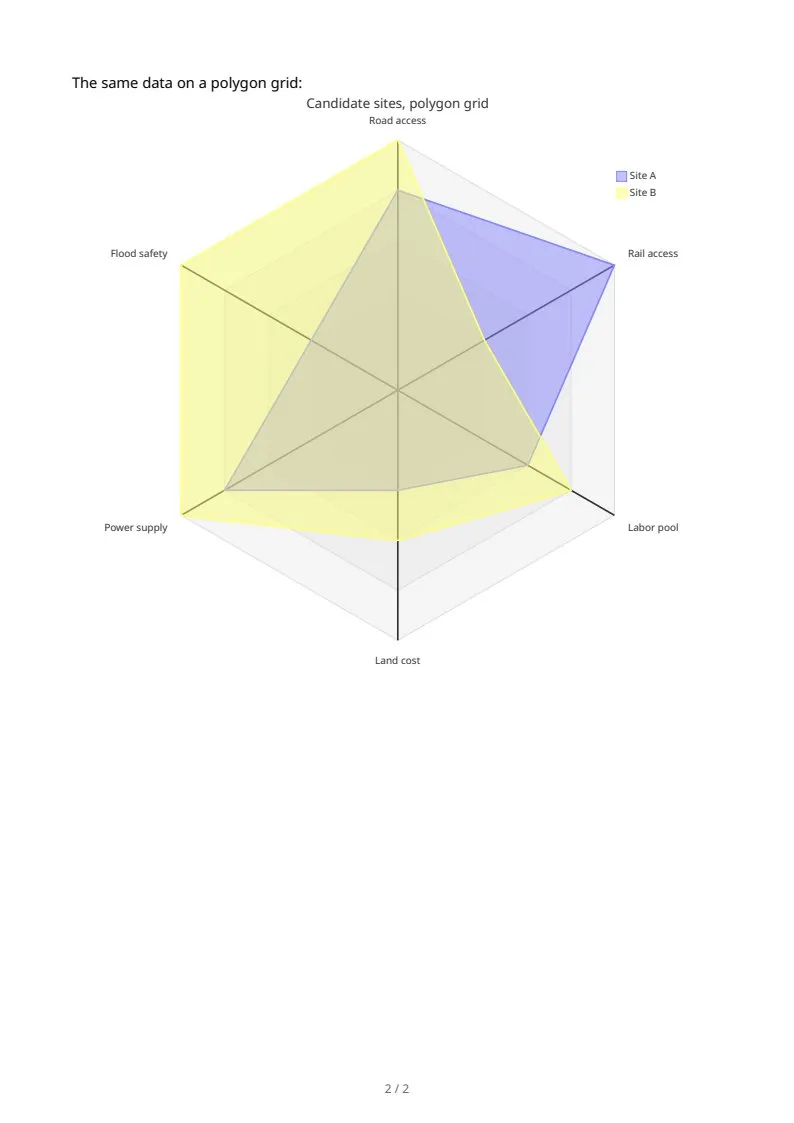
The same data on a polygon grid:
```mermaid
radar
title Candidate sites, polygon grid
axis road["Road access"], rail["Rail access"], labor["Labor pool"]
axis cost["Land cost"], grid["Power supply"], flood["Flood safety"]
curve a["Site A"]{4, 5, 3, 2, 4, 2}
curve b["Site B"]{5, 2, 4, 3, 5, 5}
graticule polygon
max 5
min 0
```
Rendered pages
PDF · 2 pages · 9 KB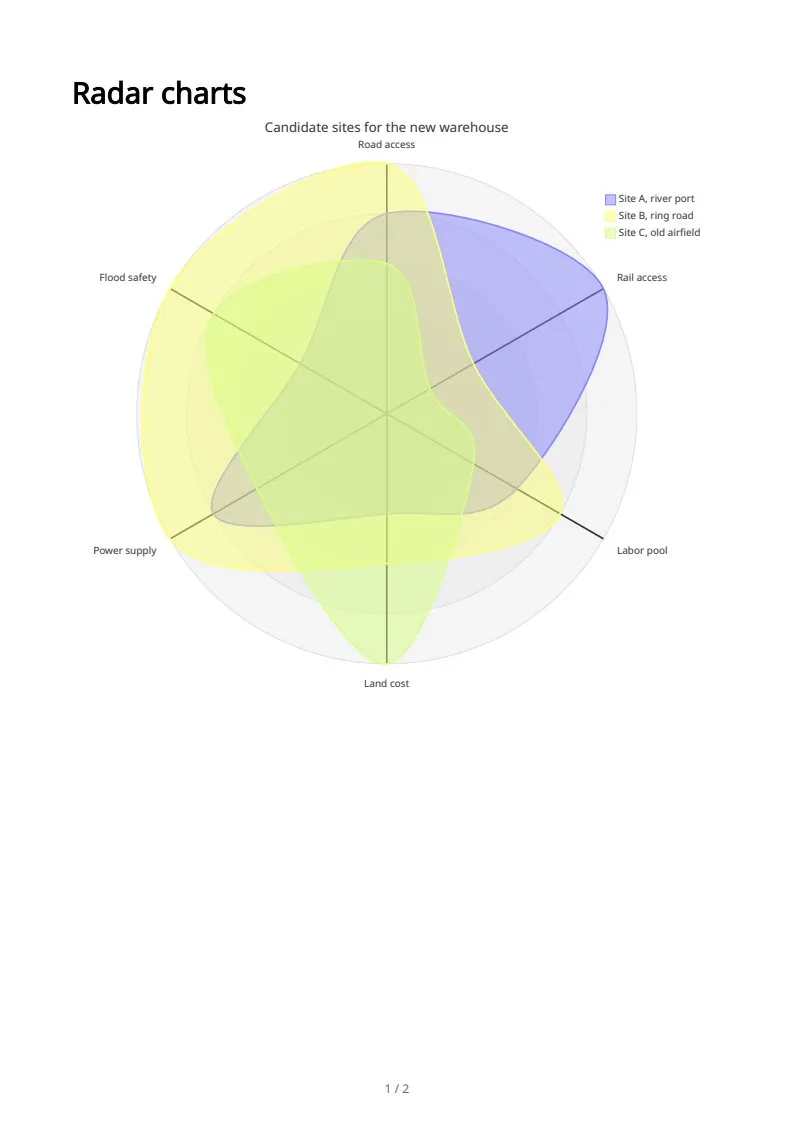
The sample documents describe invented organizations in several countries. All names and figures are illustrative.
Mermaid charts in Markdown to PDF: every sampleIn the Markdown reference